 Web Server Statistics for qpdsales.ayisagi.org
Program started on Thu, Jan 31 2019 at 12:01 PM.
Analyzed requests from Tue, Nov 27 2018 at 8:32 AM to Thu, Jan 31 2019 at 11:14 AM (65.11 days).
Web Server Statistics for qpdsales.ayisagi.orgProgram started on Thu, Jan 31 2019 at 12:01 PM.
Analyzed requests from Tue, Nov 27 2018 at 8:32 AM to Thu, Jan 31 2019 at 11:14 AM (65.11 days).
(Go To: Top | General Summary | Monthly Report | Daily Summary | Hourly Summary | Domain Report | Organization Report | Browser Report | Browser Summary | Operating System Report | Status Code Report | File Size Report | File Type Report | Directory Report | Request Report)
Figures in parentheses refer to the 7-day period ending Jan 31 2019 at 12:01 PM.
Successful requests: 20 (2)
Successful requests for pages: 17 (2)
Distinct files requested: 6 (6)
Distinct hosts served: 12 (12)
Data transferred: 10.56 kilobytes (1.22 kilobytes)
Average data transferred per day: 166 bytes (178 bytes)
(Go To: Top | General Summary | Monthly Report | Daily Summary | Hourly Summary | Domain Report | Organization Report | Browser Report | Browser Summary | Operating System Report | Status Code Report | File Size Report | File Type Report | Directory Report | Request Report)
Each unit ( ) represents 1 request for a page.
| month | #reqs | #pages | |
|---|---|---|---|
| Nov 2018 | 5 | 2 |  |
| Dec 2018 | 5 | 5 |  |
| Jan 2019 | 10 | 10 |  |
Busiest month: Jan 2019 (10 requests for pages).
(Go To: Top | General Summary | Monthly Report | Daily Summary | Hourly Summary | Domain Report | Organization Report | Browser Report | Browser Summary | Operating System Report | Status Code Report | File Size Report | File Type Report | Directory Report | Request Report)
Each unit () represents 1 request for a page.
| day | #reqs | #pages | |
|---|---|---|---|
| Sun | 2 | 2 | |
| Mon | 1 | 1 | |
| Tue | 8 | 5 | |
| Wed | 3 | 3 | |
| Thu | 3 | 3 | |
| Fri | 3 | 3 | |
| Sat | 0 | 0 |
(Go To: Top | General Summary | Monthly Report | Daily Summary | Hourly Summary | Domain Report | Organization Report | Browser Report | Browser Summary | Operating System Report | Status Code Report | File Size Report | File Type Report | Directory Report | Request Report)
Each unit () represents 1 request for a page.
| hour | #reqs | #pages | |
|---|---|---|---|
| 0 | 0 | 0 | |
| 1 | 1 | 1 | |
| 2 | 2 | 2 | |
| 3 | 1 | 1 | |
| 4 | 0 | 0 | |
| 5 | 0 | 0 | |
| 6 | 1 | 1 | |
| 7 | 0 | 0 | |
| 8 | 3 | 0 | |
| 9 | 0 | 0 | |
| 10 | 0 | 0 | |
| 11 | 2 | 2 | |
| 12 | 0 | 0 | |
| 13 | 2 | 2 | |
| 14 | 0 | 0 | |
| 15 | 0 | 0 | |
| 16 | 1 | 1 | |
| 17 | 1 | 1 | |
| 18 | 0 | 0 | |
| 19 | 0 | 0 | |
| 20 | 2 | 2 | |
| 21 | 2 | 2 | |
| 22 | 0 | 0 | |
| 23 | 2 | 2 | |
(Go To: Top | General Summary | Monthly Report | Daily Summary | Hourly Summary | Domain Report | Organization Report | Browser Report | Browser Summary | Operating System Report | Status Code Report | File Size Report | File Type Report | Directory Report | Request Report)
Listing domains, sorted by the amount of traffic.
| #reqs | %bytes | domain |
|---|---|---|
| 20 | 100% | [unresolved numerical addresses] |
(Go To: Top | General Summary | Monthly Report | Daily Summary | Hourly Summary | Domain Report | Organization Report | Browser Report | Browser Summary | Operating System Report | Status Code Report | File Size Report | File Type Report | Directory Report | Request Report)
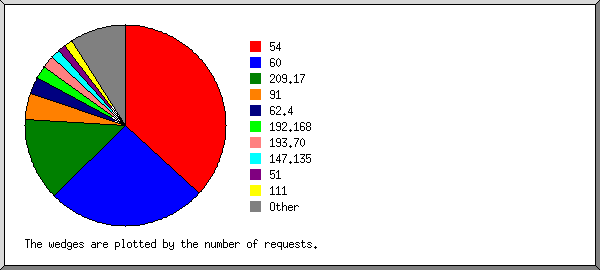
Listing organizations, sorted by the number of requests.
| #reqs | %bytes | organization |
|---|---|---|
| 7 | 40.35% | 60 |
| 4 | 23.05% | 209.17 |
| 2 | 1.42% | 91 |
| 1 | 0.59% | 192.168 |
| 1 | 5.76% | 62.4 |
| 1 | 5.76% | 104 |
| 1 | 5.76% | 5 |
| 1 | 5.76% | 34 |
| 1 | 5.76% | 195.154 |
| 1 | 5.76% | 52 |
(Go To: Top | General Summary | Monthly Report | Daily Summary | Hourly Summary | Domain Report | Organization Report | Browser Report | Browser Summary | Operating System Report | Status Code Report | File Size Report | File Type Report | Directory Report | Request Report)
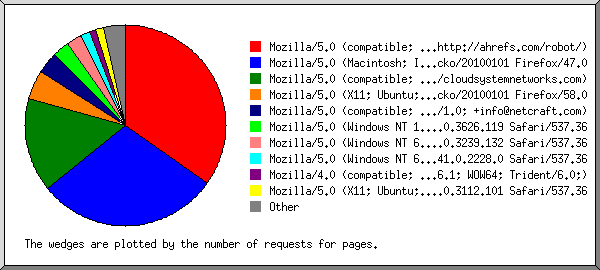
Listing browsers with at least 1 request for a page, sorted by the number of requests for pages.
| #reqs | #pages | browser |
|---|---|---|
| 7 | 7 | Mozilla/5.0 (Macintosh; Intel Mac OS X 10.11; rv:47.0) Gecko/20100101 Firefox/47.0 |
| 4 | 4 | Mozilla/5.0 (compatible; Nimbostratus-Bot/v1.3.2; http://cloudsystemnetworks.com) |
| 2 | 2 | Mozilla/5.0 (X11; Ubuntu; Linux x86_64) AppleWebKit/537.36 (KHTML, like Gecko) Chrome/60.0.3112.101 Safari/537.36 |
| 2 | 2 | Mozilla/5.0 (X11; Ubuntu; Linux x86_64; rv:58.0) Gecko/20100101 Firefox/58.0 |
| 1 | 1 | Mozilla/5.0 (Windows NT 6.1; WOW64) AppleWebKit/537.36 (KHTML, like Gecko) Chrome/34.0.1847.131 Safari/537.36 |
| 1 | 1 | Opera/9.80 (X11; Linux i686; U; Edition Linux Mint; de) Presto/2.10.289 Version/12.02 |
| 3 | 0 | [not listed: 1 browser] |
(Go To: Top | General Summary | Monthly Report | Daily Summary | Hourly Summary | Domain Report | Organization Report | Browser Report | Browser Summary | Operating System Report | Status Code Report | File Size Report | File Type Report | Directory Report | Request Report)
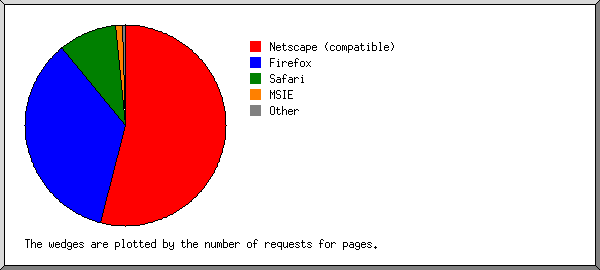
Listing browsers with at least 1 request for a page, sorted by the number of requests for pages.
| # | #reqs | #pages | browser |
|---|---|---|---|
| 1 | 9 | 9 | Firefox |
| 7 | 7 | Firefox/47 | |
| 2 | 2 | Firefox/58 | |
| 2 | 4 | 4 | Netscape (compatible) |
| 3 | 3 | 3 | Safari |
| 3 | 3 | Safari/537 | |
| 4 | 1 | 1 | Opera |
| 1 | 1 | Opera/9 | |
| 3 | 0 | [not listed: 1 browser] |
(Go To: Top | General Summary | Monthly Report | Daily Summary | Hourly Summary | Domain Report | Organization Report | Browser Report | Browser Summary | Operating System Report | Status Code Report | File Size Report | File Type Report | Directory Report | Request Report)
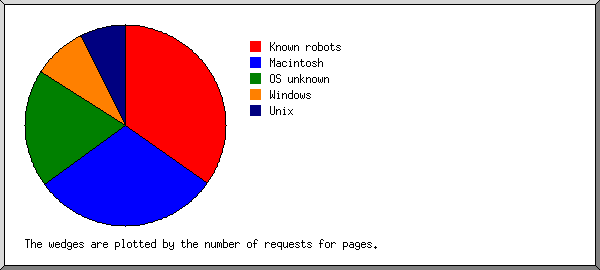
Listing operating systems, sorted by the number of requests for pages.
| # | #reqs | #pages | OS |
|---|---|---|---|
| 1 | 7 | 7 | Macintosh |
| 2 | 5 | 5 | Unix |
| 5 | 5 | Linux | |
| 3 | 7 | 4 | OS unknown |
| 4 | 1 | 1 | Windows |
| 1 | 1 | Unknown Windows |
(Go To: Top | General Summary | Monthly Report | Daily Summary | Hourly Summary | Domain Report | Organization Report | Browser Report | Browser Summary | Operating System Report | Status Code Report | File Size Report | File Type Report | Directory Report | Request Report)
Listing status codes, sorted numerically.
| #reqs | status code |
|---|---|
| 20 | 200 OK |
(Go To: Top | General Summary | Monthly Report | Daily Summary | Hourly Summary | Domain Report | Organization Report | Browser Report | Browser Summary | Operating System Report | Status Code Report | File Size Report | File Type Report | Directory Report | Request Report)
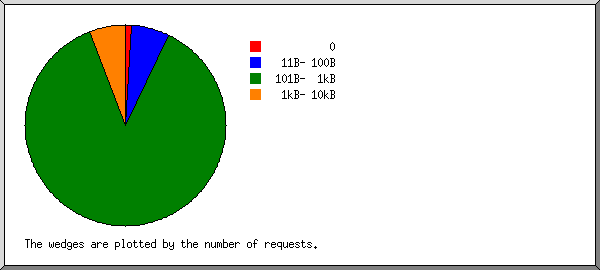
| size | #reqs | %bytes |
|---|---|---|
| 0 | 0 | |
| 1B- 10B | 0 | |
| 11B- 100B | 3 | 2.02% |
| 101B- 1kB | 17 | 97.98% |
(Go To: Top | General Summary | Monthly Report | Daily Summary | Hourly Summary | Domain Report | Organization Report | Browser Report | Browser Summary | Operating System Report | Status Code Report | File Size Report | File Type Report | Directory Report | Request Report)
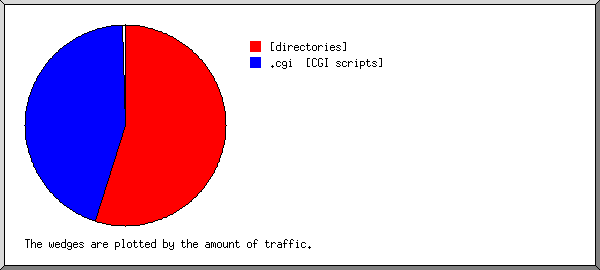
Listing extensions with at least 0.1% of the traffic, sorted by the amount of traffic.
| #reqs | %bytes | extension |
|---|---|---|
| 17 | 97.98% | [directories] |
| 3 | 2.02% | .txt [Plain text] |
(Go To: Top | General Summary | Monthly Report | Daily Summary | Hourly Summary | Domain Report | Organization Report | Browser Report | Browser Summary | Operating System Report | Status Code Report | File Size Report | File Type Report | Directory Report | Request Report)
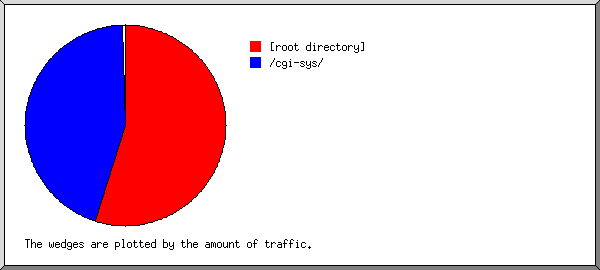
Listing directories with at least 0.01% of the traffic, sorted by the amount of traffic.
| #reqs | %bytes | directory |
|---|---|---|
| 17 | 97.98% | [root directory] |
| 3 | 2.02% | /.well-known/ |
(Go To: Top | General Summary | Monthly Report | Daily Summary | Hourly Summary | Domain Report | Organization Report | Browser Report | Browser Summary | Operating System Report | Status Code Report | File Size Report | File Type Report | Directory Report | Request Report)
Listing files with at least 20 requests, sorted by the number of requests.
| #reqs | %bytes | last time | file |
|---|---|---|---|
| 20 | 100% | Jan/31/19 11:14 AM | [not listed: 3 files] |