Web Server Statistics for halsidsales.ayisagi.org
Program started on Thu, Jan 31 2019 at 12:01 PM.
Analyzed requests from Wed, Nov 28 2018 at 11:03 PM to Thu, Jan 31 2019 at 6:04 AM (63.29 days).
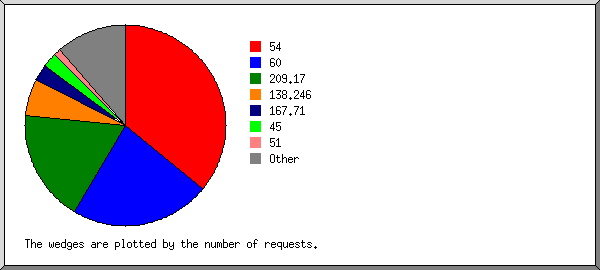
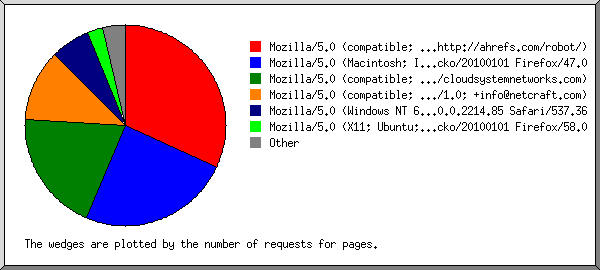
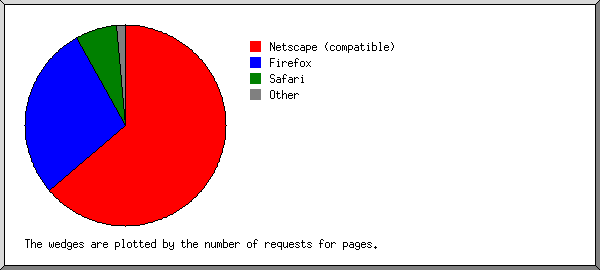
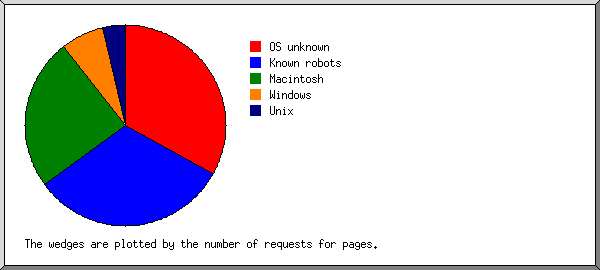
 ) represents 1 request for a page.