 Web Server Statistics for qpdsales.ayisagi.org
Program started on Tue, Dec 24 2019 at 12:06 PM.
Analyzed requests from Wed, Nov 28 2018 at 9:44 PM to Tue, Dec 24 2019 at 8:43 AM (390.46 days).
Web Server Statistics for qpdsales.ayisagi.orgProgram started on Tue, Dec 24 2019 at 12:06 PM.
Analyzed requests from Wed, Nov 28 2018 at 9:44 PM to Tue, Dec 24 2019 at 8:43 AM (390.46 days).
(Go To: Top | General Summary | Monthly Report | Daily Summary | Hourly Summary | Domain Report | Organization Report | Browser Report | Browser Summary | Operating System Report | Status Code Report | File Size Report | File Type Report | Directory Report | Request Report)
Figures in parentheses refer to the 7-day period ending Dec 24 2019 at 12:06 PM.
Successful requests: 359 (8)
Successful requests for pages: 337 (7)
Failed requests: 158 (0)
Redirected requests: 8 (0)
Distinct files requested: 22 (58)
Distinct hosts served: 187 (278)
Data transferred: 354.88 kilobytes (10.46 kilobytes)
Average data transferred per day: 930 bytes (1.49 kilobytes)
(Go To: Top | General Summary | Monthly Report | Daily Summary | Hourly Summary | Domain Report | Organization Report | Browser Report | Browser Summary | Operating System Report | Status Code Report | File Size Report | File Type Report | Directory Report | Request Report)
Each unit ( ) represents 2 requests for pages or part thereof.
| month | #reqs | #pages | |
|---|---|---|---|
| Nov 2018 | 1 | 1 | |
| Dec 2018 | 6 | 6 |  |
| Jan 2019 | 10 | 10 |  |
| Feb 2019 | 16 | 16 |  |
| Mar 2019 | 29 | 29 | |
| Apr 2019 | 36 | 36 |  |
| May 2019 | 48 | 39 | |
| Jun 2019 | 26 | 24 | |
| Jul 2019 | 45 | 42 | |
| Aug 2019 | 39 | 39 | |
| Sep 2019 | 37 | 35 | |
| Oct 2019 | 21 | 19 | |
| Nov 2019 | 21 | 19 | |
| Dec 2019 | 24 | 22 | |
Busiest month: Jul 2019 (42 requests for pages).
(Go To: Top | General Summary | Monthly Report | Daily Summary | Hourly Summary | Domain Report | Organization Report | Browser Report | Browser Summary | Operating System Report | Status Code Report | File Size Report | File Type Report | Directory Report | Request Report)
Each unit () represents 2 requests for pages or part thereof.
| day | #reqs | #pages | |
|---|---|---|---|
| Sun | 46 | 40 | |
| Mon | 44 | 43 | |
| Tue | 64 | 64 |  |
| Wed | 52 | 49 | |
| Thu | 50 | 45 | |
| Fri | 53 | 49 | |
| Sat | 50 | 47 | |
(Go To: Top | General Summary | Monthly Report | Daily Summary | Hourly Summary | Domain Report | Organization Report | Browser Report | Browser Summary | Operating System Report | Status Code Report | File Size Report | File Type Report | Directory Report | Request Report)
Each unit () represents 1 request for a page.
| hour | #reqs | #pages | |
|---|---|---|---|
| 0 | 15 | 14 | |
| 1 | 19 | 18 | |
| 2 | 9 | 9 | |
| 3 | 9 | 8 | |
| 4 | 12 | 10 | |
| 5 | 26 | 25 | |
| 6 | 16 | 16 | |
| 7 | 8 | 7 | |
| 8 | 21 | 21 | |
| 9 | 17 | 16 | |
| 10 | 13 | 12 | |
| 11 | 12 | 12 | |
| 12 | 7 | 7 | |
| 13 | 17 | 12 | |
| 14 | 13 | 12 | |
| 15 | 14 | 14 | |
| 16 | 17 | 17 | |
| 17 | 18 | 18 | |
| 18 | 8 | 6 | |
| 19 | 18 | 18 | |
| 20 | 18 | 16 | |
| 21 | 19 | 18 | |
| 22 | 12 | 12 | |
| 23 | 21 | 19 | |
(Go To: Top | General Summary | Monthly Report | Daily Summary | Hourly Summary | Domain Report | Organization Report | Browser Report | Browser Summary | Operating System Report | Status Code Report | File Size Report | File Type Report | Directory Report | Request Report)
Listing domains, sorted by the amount of traffic.
| #reqs | %bytes | domain |
|---|---|---|
| 359 | 100% | [unresolved numerical addresses] |
(Go To: Top | General Summary | Monthly Report | Daily Summary | Hourly Summary | Domain Report | Organization Report | Browser Report | Browser Summary | Operating System Report | Status Code Report | File Size Report | File Type Report | Directory Report | Request Report)
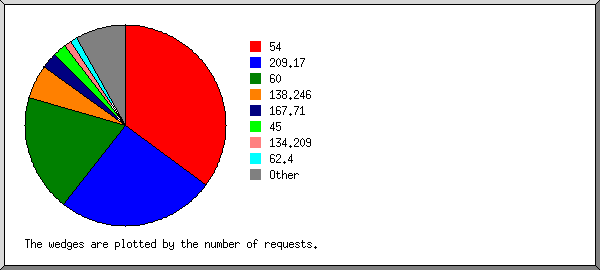
Listing the top 20 organizations by the number of requests, sorted by the number of requests.
| #reqs | %bytes | organization |
|---|---|---|
| 126 | 63.83% | 54 |
| 91 | 15.60% | 209.17 |
| 68 | 11.66% | 60 |
| 20 | 138.246 | |
| 9 | 1.54% | 167.71 |
| 8 | 1.20% | 45 |
| 4 | 0.69% | 134.209 |
| 4 | 0.69% | 62.4 |
| 3 | 0.51% | 157.245 |
| 3 | 0.51% | 138.197 |
| 3 | 0.51% | 68.183 |
| 2 | 0.34% | 159.203 |
| 2 | 0.34% | 212.83 |
| 2 | 0.34% | 111 |
| 2 | 0.34% | 171.67 |
| 2 | 0.34% | 159.65 |
| 2 | 0.34% | 209.97 |
| 1 | 209.250 | |
| 1 | 0.17% | 165.227 |
| 1 | 0.17% | 167.172 |
| 5 | 0.86% | [not listed: 5 organizations] |
(Go To: Top | General Summary | Monthly Report | Daily Summary | Hourly Summary | Domain Report | Organization Report | Browser Report | Browser Summary | Operating System Report | Status Code Report | File Size Report | File Type Report | Directory Report | Request Report)
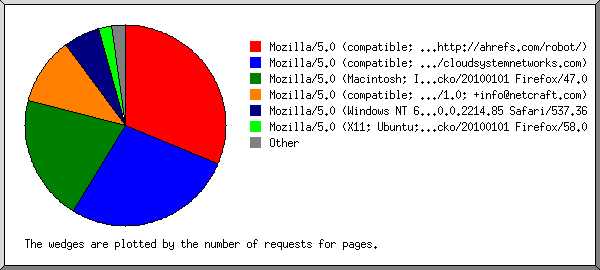
Listing browsers with at least 1 request for a page, sorted by the number of requests for pages.
| #reqs | #pages | browser |
|---|---|---|
| 126 | 104 | Mozilla/5.0 (compatible; AhrefsBot/6.1; +http://ahrefs.com/robot/) |
| 91 | 91 | Mozilla/5.0 (compatible; Nimbostratus-Bot/v1.3.2; http://cloudsystemnetworks.com) |
| 68 | 68 | Mozilla/5.0 (Macintosh; Intel Mac OS X 10.11; rv:47.0) Gecko/20100101 Firefox/47.0 |
| 36 | 36 | Mozilla/5.0 (compatible; NetcraftSurveyAgent/1.0; +info@netcraft.com) |
| 20 | 20 | Mozilla/5.0 (Windows NT 6.1; Win64; x64) AppleWebKit/537.36 (KHTML, like Gecko) Chrome/40.0.2214.85 Safari/537.36 |
| 7 | 7 | Mozilla/5.0 (X11; Ubuntu; Linux x86_64; rv:58.0) Gecko/20100101 Firefox/58.0 |
| 2 | 2 | Mozilla/5.0 zgrab/0.x |
| 2 | 2 | Mozilla/5.0 (Macintosh; Intel Mac OS X 10_13_6) AppleWebKit/537.36 (KHTML, like Gecko) Chrome/72.0.3626.121 Safari/537.36 |
| 1 | 1 | Mozilla/5.0 (X11; U; Linux x86_64; de; rv:1.9.2.8) Gecko/20100723 Ubuntu/10.04 (lucid) Firefox/3.6.8 |
| 1 | 1 | Mozilla/5.0 (compatible; Nmap Scripting Engine; https://nmap.org/book/nse.html) |
| 1 | 1 | Mozilla/5.0 (X11; Ubuntu; Linux x86_64; rv:62.0) Gecko/20100101 Firefox/62.0 |
(Go To: Top | General Summary | Monthly Report | Daily Summary | Hourly Summary | Domain Report | Organization Report | Browser Report | Browser Summary | Operating System Report | Status Code Report | File Size Report | File Type Report | Directory Report | Request Report)
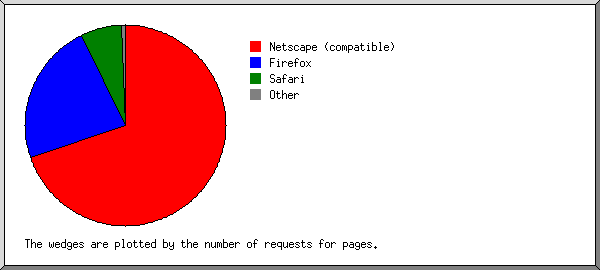
Listing browsers with at least 1 request for a page, sorted by the number of requests for pages.
| # | #reqs | #pages | browser |
|---|---|---|---|
| 1 | 254 | 232 | Netscape (compatible) |
| 2 | 77 | 77 | Firefox |
| 68 | 68 | Firefox/47 | |
| 7 | 7 | Firefox/58 | |
| 1 | 1 | Firefox/62 | |
| 1 | 1 | Firefox/3 | |
| 3 | 22 | 22 | Safari |
| 22 | 22 | Safari/537 | |
| 4 | 2 | 2 | Mozilla |
(Go To: Top | General Summary | Monthly Report | Daily Summary | Hourly Summary | Domain Report | Organization Report | Browser Report | Browser Summary | Operating System Report | Status Code Report | File Size Report | File Type Report | Directory Report | Request Report)
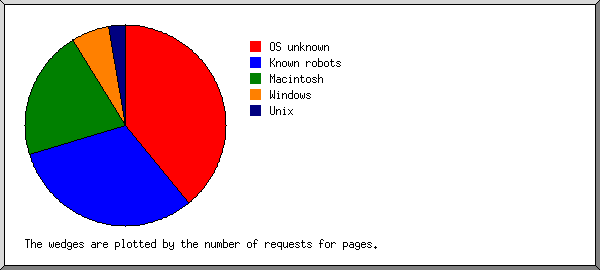
Listing operating systems, sorted by the number of requests for pages.
| # | #reqs | #pages | OS |
|---|---|---|---|
| 1 | 130 | 130 | OS unknown |
| 2 | 126 | 104 | Known robots |
| 3 | 70 | 70 | Macintosh |
| 4 | 20 | 20 | Windows |
| 20 | 20 | Unknown Windows | |
| 5 | 9 | 9 | Unix |
| 9 | 9 | Linux |
(Go To: Top | General Summary | Monthly Report | Daily Summary | Hourly Summary | Domain Report | Organization Report | Browser Report | Browser Summary | Operating System Report | Status Code Report | File Size Report | File Type Report | Directory Report | Request Report)
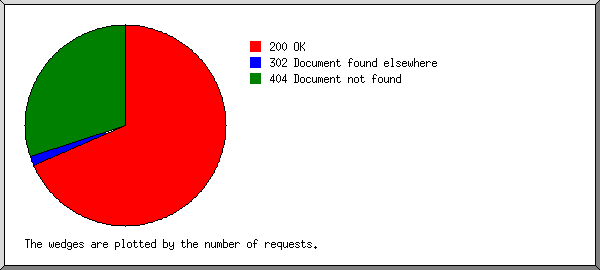
Listing status codes, sorted numerically.
| #reqs | status code |
|---|---|
| 359 | 200 OK |
| 8 | 302 Document found elsewhere |
| 158 | 404 Document not found |
(Go To: Top | General Summary | Monthly Report | Daily Summary | Hourly Summary | Domain Report | Organization Report | Browser Report | Browser Summary | Operating System Report | Status Code Report | File Size Report | File Type Report | Directory Report | Request Report)
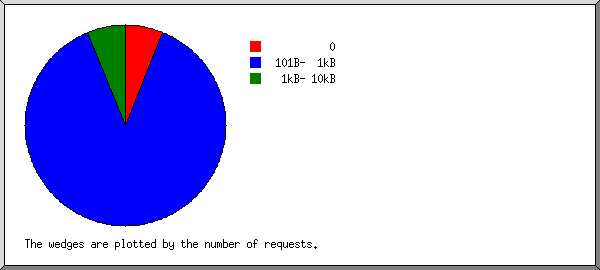
| size | #reqs | %bytes |
|---|---|---|
| 0 | 22 | |
| 1B- 10B | 0 | |
| 11B- 100B | 0 | |
| 101B- 1kB | 315 | 54.00% |
| 1kB- 10kB | 22 | 46.00% |
(Go To: Top | General Summary | Monthly Report | Daily Summary | Hourly Summary | Domain Report | Organization Report | Browser Report | Browser Summary | Operating System Report | Status Code Report | File Size Report | File Type Report | Directory Report | Request Report)
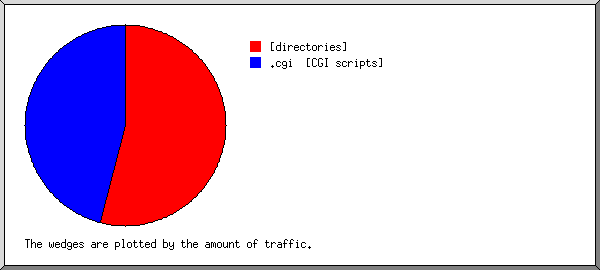
Listing extensions with at least 0.1% of the traffic, sorted by the amount of traffic.
| #reqs | %bytes | extension |
|---|---|---|
| 337 | 54.00% | [directories] |
| 22 | 46.00% | .cgi [CGI scripts] |
(Go To: Top | General Summary | Monthly Report | Daily Summary | Hourly Summary | Domain Report | Organization Report | Browser Report | Browser Summary | Operating System Report | Status Code Report | File Size Report | File Type Report | Directory Report | Request Report)

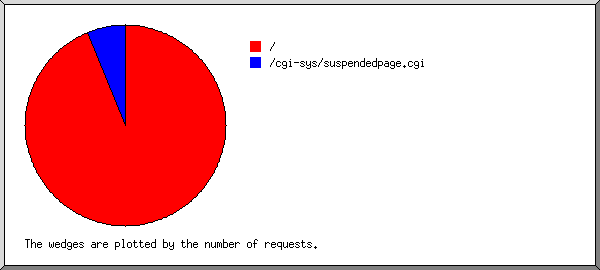
Listing directories with at least 0.01% of the traffic, sorted by the amount of traffic.
| #reqs | %bytes | directory |
|---|---|---|
| 337 | 54.00% | [root directory] |
| 22 | 46.00% | /cgi-sys/ |
(Go To: Top | General Summary | Monthly Report | Daily Summary | Hourly Summary | Domain Report | Organization Report | Browser Report | Browser Summary | Operating System Report | Status Code Report | File Size Report | File Type Report | Directory Report | Request Report)
Listing files with at least 20 requests, sorted by the number of requests.
| #reqs | %bytes | last time | file |
|---|---|---|---|
| 337 | 54.00% | Dec/24/19 8:43 AM | / |
| 101 | 15.26% | Dec/23/19 12:14 PM | /?134.209.46.18 |
| 10 | 1.71% | Jun/ 6/19 2:07 AM | /?54.36.149.51 |
| 10 | 1.71% | Mar/ 5/19 1:51 AM | /?209.17.96.42 |
| 22 | 46.00% | Dec/21/19 3:47 AM | /cgi-sys/suspendedpage.cgi |