Web Server Statistics for saaandsons.ayisagi.org
Program started on Thu, Jan 31 2019 at 12:01 PM.
Analyzed requests from Mon, Jul 09 2018 at 9:39 AM to Thu, Jan 31 2019 at 10:14 AM (206.02 days).
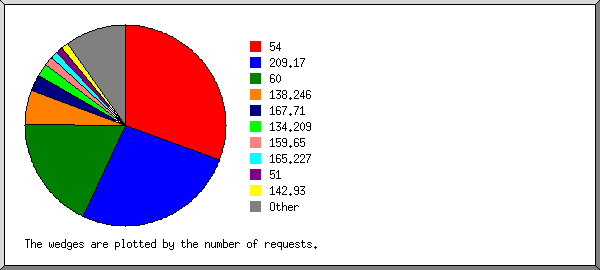
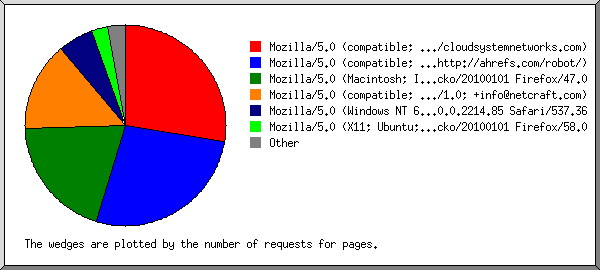
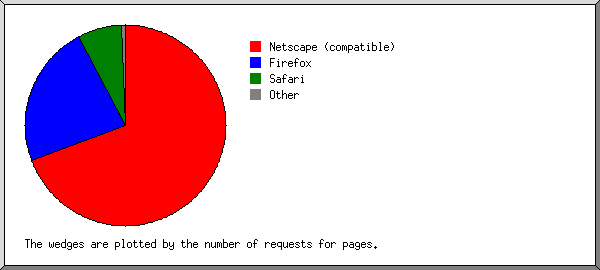
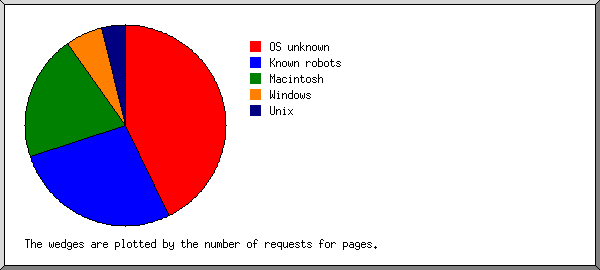
 ) represents 1 request for a page.